
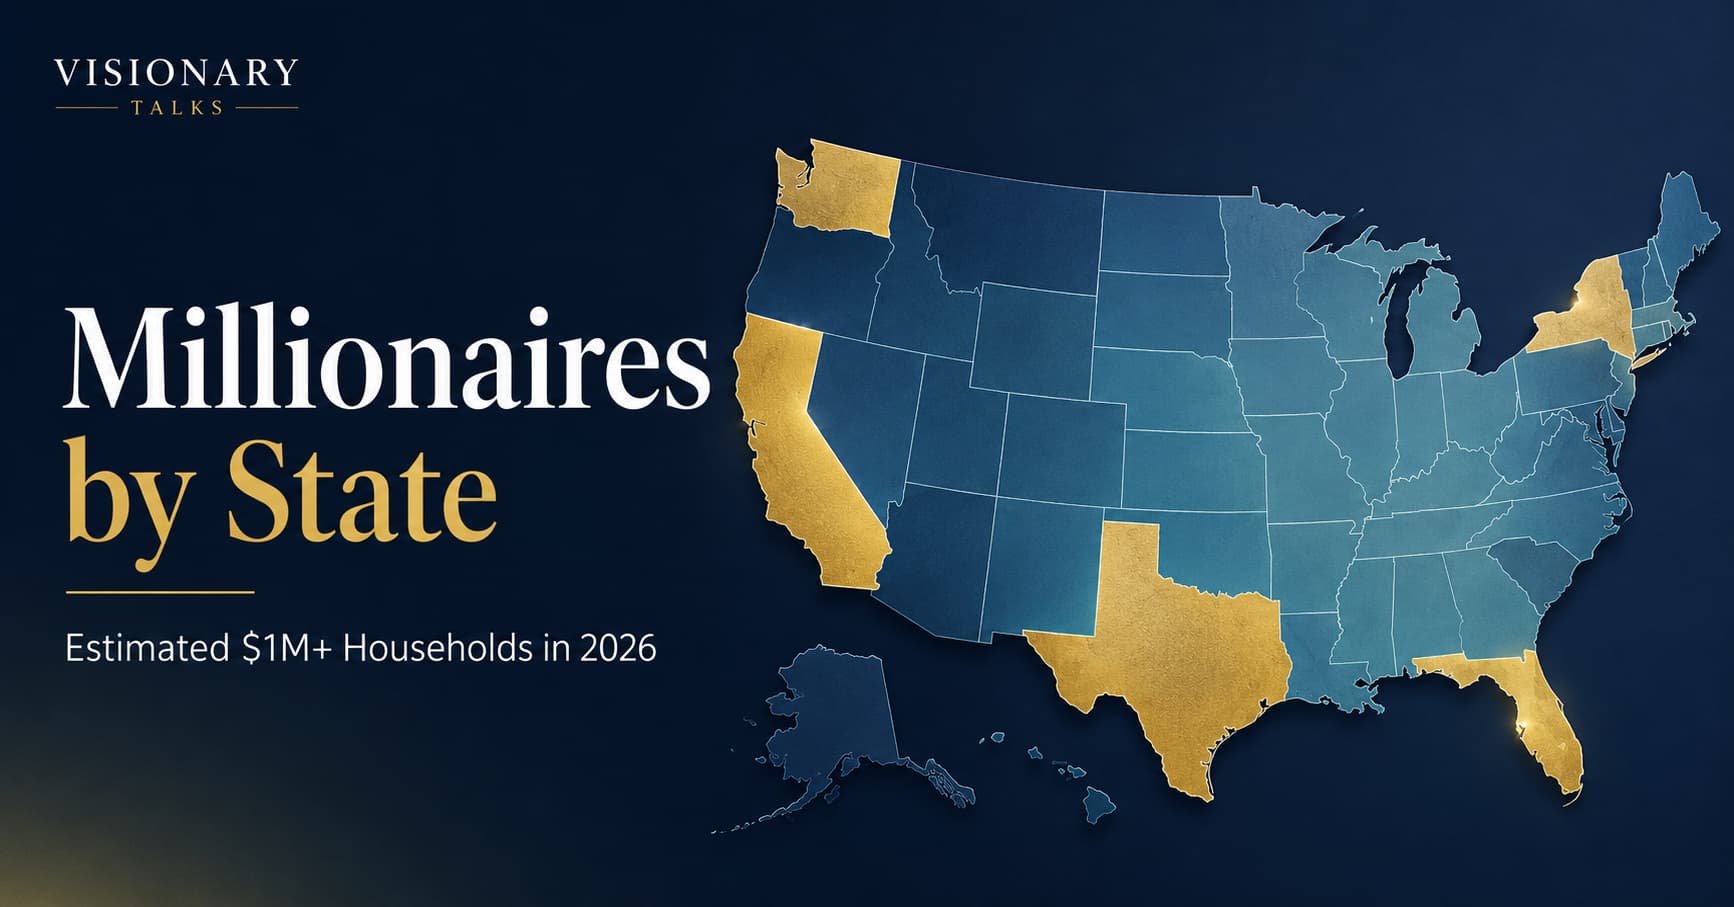
Where millionaire households live
Households with net worth of $1 million or more, including home equity.
Hover, tap or use Tab and Enter to explore. Alaska and Hawaii appear as insets. Counts are rounded estimates; household shares are calculated from those rounded inputs.
Source, methodology & all 51 figures
Visionary Talks independently checked the source table and joined each jurisdiction to Census-derived state boundaries. The Windfall April 2026 household estimates measure assets less liabilities, including property. They count households, not individual people or only investable assets. Checked October 11, 2026. This is a dated snapshot.
| State | Millionaire households | Total households | Share |
|---|---|---|---|
| 3,590,000 | 12,430,000 | 28.9% | |
| 1,850,000 | 9,170,000 | 20.2% | |
| 1,550,000 | 7,410,000 | 20.9% | |
| 960,000 | 3,240,000 | 29.6% | |
| 960,000 | 10,140,000 | 9.5% | |
| 790,000 | 3,170,000 | 24.9% | |
| 760,000 | 4,060,000 | 18.7% | |
| 730,000 | 2,980,000 | 24.5% | |
| 690,000 | 3,720,000 | 18.5% | |
| 680,000 | 3,240,000 | 21.0% | |
| 650,000 | 4,900,000 | 13.3% | |
| 570,000 | 4,040,000 | 14.1% | |
| 540,000 | 2,420,000 | 22.3% | |
| 540,000 | 4,870,000 | 11.1% | |
| 540,000 | 2,560,000 | 21.1% | |
| 500,000 | 2,710,000 | 18.5% | |
| 470,000 | 4,470,000 | 10.5% | |
| 430,000 | 2,250,000 | 19.1% | |
| 390,000 | 2,250,000 | 17.3% | |
| 380,000 | 2,410,000 | 15.8% | |
| 370,000 | 2,050,000 | 18.0% | |
| 360,000 | 1,820,000 | 19.8% | |
| 290,000 | 1,440,000 | 20.1% | |
| 260,000 | 1,120,000 | 23.2% | |
| 240,000 | 1,770,000 | 13.6% | |
| 240,000 | 2,670,000 | 9.0% | |
| 210,000 | 1,160,000 | 18.1% | |
| 190,000 | 1,600,000 | 11.9% | |
| 170,000 | 480,000 | 35.4% | |
| 160,000 | 2,410,000 | 6.6% | |
| 160,000 | 600,000 | 26.7% | |
| 140,000 | 1,420,000 | 9.9% | |
| 130,000 | 1,290,000 | 10.1% | |
| 120,000 | 1,170,000 | 10.3% | |
| 120,000 | 670,000 | 17.9% | |
| 110,000 | 1,680,000 | 6.5% | |
| 110,000 | 640,000 | 17.2% | |
| 100,000 | 440,000 | 22.7% | |
| 100,000 | 280,000 | 35.7% | |
| 80,000 | 390,000 | 20.5% | |
| 80,000 | 730,000 | 11.0% | |
| 70,000 | 1,080,000 | 6.5% | |
| 70,000 | 710,000 | 9.9% | |
| 60,000 | 410,000 | 14.6% | |
| 50,000 | 930,000 | 5.4% | |
| 50,000 | 710,000 | 7.0% | |
| 50,000 | 300,000 | 16.7% | |
| 50,000 | 380,000 | 13.2% | |
| 30,000 | 240,000 | 12.5% | |
| 30,000 | 210,000 | 14.3% | |
| 20,000 | 260,000 | 7.7% |
Boundaries: US Atlas / US Census Bureau, 2017, Albers USA projection. Color bands represent values, not state size.
How many millionaires by state are there in 2026? That sounds like a simple question, but after reviewing the latest wealth data, I found that most rankings on this topic make a basic mistake. They treat “millionaire” as if it always means the same thing.
It does not.
A household with a $1.2 million net worth, most of it tied up in a house, is not the same as a person with $1 million in liquid investable assets. A founder with startup equity is not the same as a retiree with home equity and a 401(k). And someone earning $1 million in one tax year is not necessarily a millionaire at all, especially if they have debt, taxes, or one-time capital gains.
That distinction matters because the US wealth boom has become one of the defining financial stories of 2026. Stock market gains, AI-driven equity valuations, home-price appreciation, inheritance, business ownership, and interstate migration have created very different millionaire maps depending on what you measure.
In this article, I set out to answer one question clearly: how many millionaire households are there in each US state? I use net worth as the primary definition, then compare that with investable-asset and income-based definitions so the numbers are not misleading.
Key Takeaways
- California has the most millionaire households by far, with about 3.59 million households worth $1 million or more.
- Florida is second with about 1.85 million millionaire households, reflecting migration, retirees, real estate wealth, and tax-driven relocation.
- New York ranks third by count, with about 1.55 million millionaire households, but its median household net worth is much lower than many smaller states.
- Vermont and Hawaii have the highest millionaire-household density, with roughly 36% and 35% of households above $1 million in net worth.
- Texas has a large number of millionaire households, about 960,000, but a much lower millionaire share than coastal wealth states because its household base is so large.
- The biggest mistake in “millionaires by state” rankings is mixing net worth, investable assets, and annual income as if they are the same metric.
- My estimate from the 2026 state-level household dataset comes to about 21.8 million millionaire households across the covered US household universe.
Methodology: What I Mean by “Millionaire by State”
For the main table in this article, I define a millionaire household as:
A household with net worth of $1 million or more.
That is the broadest and most intuitive definition. It generally includes home equity, retirement accounts, brokerage assets, business equity, cash, and other assets, minus debt.
The main state-level dataset I use comes from Windfall Data’s 2026 state wealth analysis, which was pulled as of April 2026 and covers more than 120 million US households. I then calculated each state’s millionaire share by dividing millionaire households by total households in the dataset.
I cross-checked the broader national picture with Capgemini’s World Wealth Report 2026, which uses a stricter high-net-worth individual definition based on investable assets, and UBS’s Global Wealth Report 2025, which places the US at 39.7% of the world’s millionaires.
I also reviewed the Federal Reserve Distributional Financial Accounts for the national wealth concentration backdrop, and the IRS state income data to separate millionaire wealth from millionaire income.
Important note: state-level counts below are rounded estimates. They are best read as directional wealth-market estimates, not exact census counts.
How Many Millionaires by State? Full 2026 Table
| Rank by Count | State | Millionaire Households | Total Households | Millionaire Share | Median Household Net Worth | Net Worth Needed for Top 1% |
|---|---|---|---|---|---|---|
| 1 | California | 3,590,000 | 12,430,000 | 28.9% | $406,000 | $19.75M |
| 2 | Florida | 1,850,000 | 9,170,000 | 20.2% | $318,000 | $12.78M |
| 3 | New York | 1,550,000 | 7,410,000 | 20.9% | $159,000 | $11.55M |
| 4 | New Jersey | 960,000 | 3,240,000 | 29.6% | $601,000 | $10.98M |
| 5 | Texas | 960,000 | 10,140,000 | 9.5% | $279,000 | $5.32M |
| 6 | Washington | 790,000 | 3,170,000 | 24.9% | $431,000 | $12.01M |
| 7 | North Carolina | 760,000 | 4,060,000 | 18.7% | $346,000 | $8.45M |
| 8 | Massachusetts | 730,000 | 2,980,000 | 24.5% | $410,000 | $11.09M |
| 9 | Georgia | 690,000 | 3,720,000 | 18.5% | $358,000 | $7.29M |
| 10 | Virginia | 680,000 | 3,240,000 | 21.0% | $431,000 | $8.31M |
| 11 | Pennsylvania | 650,000 | 4,900,000 | 13.3% | $299,000 | $5.75M |
| 12 | Michigan | 570,000 | 4,040,000 | 14.1% | $313,000 | $5.69M |
| 13 | Colorado | 540,000 | 2,420,000 | 22.3% | $429,000 | $12.63M |
| 14 | Illinois | 540,000 | 4,870,000 | 11.1% | $225,000 | $5.61M |
| 15 | Tennessee | 540,000 | 2,560,000 | 21.1% | $362,000 | $8.12M |
| 16 | Arizona | 500,000 | 2,710,000 | 18.5% | $322,000 | $9.98M |
| 17 | Ohio | 470,000 | 4,470,000 | 10.5% | $266,000 | $4.32M |
| 18 | Maryland | 430,000 | 2,250,000 | 19.1% | $406,000 | $8.08M |
| 19 | Wisconsin | 390,000 | 2,250,000 | 17.3% | $392,000 | $6.17M |
| 20 | Minnesota | 380,000 | 2,410,000 | 15.8% | $363,000 | $5.69M |
| 21 | South Carolina | 370,000 | 2,050,000 | 18.0% | $343,000 | $8.72M |
| 22 | Oregon | 360,000 | 1,820,000 | 19.8% | $336,000 | $8.48M |
| 23 | Connecticut | 290,000 | 1,440,000 | 20.1% | $423,000 | $10.81M |
| 24 | Utah | 260,000 | 1,120,000 | 23.2% | $601,000 | $10.15M |
| 25 | Alabama | 240,000 | 1,770,000 | 13.6% | $285,000 | $5.87M |
| 26 | Indiana | 240,000 | 2,670,000 | 9.0% | $265,000 | $4.38M |
| 27 | Nevada | 210,000 | 1,160,000 | 18.1% | $312,000 | $10.45M |
| 28 | Kentucky | 190,000 | 1,600,000 | 11.9% | $280,000 | $4.56M |
| 29 | Hawaii | 170,000 | 480,000 | 35.4% | $363,000 | $21.52M |
| 30 | Missouri | 160,000 | 2,410,000 | 6.6% | $231,000 | $3.80M |
| 31 | New Hampshire | 160,000 | 600,000 | 26.7% | $616,000 | $8.96M |
| 32 | Oklahoma | 140,000 | 1,420,000 | 9.9% | $210,000 | $4.35M |
| 33 | Iowa | 130,000 | 1,290,000 | 10.1% | $249,000 | $4.09M |
| 34 | Arkansas | 120,000 | 1,170,000 | 10.3% | $222,000 | $4.62M |
| 35 | Idaho | 120,000 | 670,000 | 17.9% | $463,000 | $9.11M |
| 36 | Louisiana | 110,000 | 1,680,000 | 6.5% | $184,000 | $3.62M |
| 37 | Maine | 110,000 | 640,000 | 17.2% | $463,000 | $6.57M |
| 38 | Rhode Island | 100,000 | 440,000 | 22.7% | $491,000 | $9.74M |
| 39 | Vermont | 100,000 | 280,000 | 35.7% | $703,000 | $9.83M |
| 40 | Delaware | 80,000 | 390,000 | 20.5% | $471,000 | $9.21M |
| 41 | Nebraska | 80,000 | 730,000 | 11.0% | $295,000 | $4.84M |
| 42 | Kansas | 70,000 | 1,080,000 | 6.5% | $229,000 | $3.30M |
| 43 | West Virginia | 70,000 | 710,000 | 9.9% | $231,000 | $3.59M |
| 44 | Montana | 60,000 | 410,000 | 14.6% | $364,000 | $7.16M |
| 45 | Mississippi | 50,000 | 930,000 | 5.4% | $237,000 | $2.94M |
| 46 | New Mexico | 50,000 | 710,000 | 7.0% | $303,000 | $4.12M |
| 47 | South Dakota | 50,000 | 300,000 | 16.7% | $452,000 | $5.67M |
| 48 | Washington, D.C. | 50,000 | 380,000 | 13.2% | $70,000 | $11.26M |
| 49 | Alaska | 30,000 | 240,000 | 12.5% | $328,000 | $5.21M |
| 50 | Wyoming | 30,000 | 210,000 | 14.3% | $390,000 | $10.01M |
| 51 | North Dakota | 20,000 | 260,000 | 7.7% | $208,000 | $4.71M |
The 10 States With the Most Millionaires
By raw count, the millionaire map still looks like a population map mixed with a stock-market map.
| Rank | State | Millionaire Households | Why It Ranks High |
|---|---|---|---|
| 1 | California | 3.59M | Tech equity, real estate, venture capital, entertainment, public markets |
| 2 | Florida | 1.85M | Migration, retirees, real estate, no state income tax |
| 3 | New York | 1.55M | Finance, real estate, professional services, legacy wealth |
| 4 | New Jersey | 960K | NYC-linked wealth, pharma, finance, high home values |
| 5 | Texas | 960K | Energy, tech, business ownership, population scale |
| 6 | Washington | 790K | Microsoft, Amazon, cloud, software, Seattle-area wealth |
| 7 | North Carolina | 760K | Banking, software, healthcare, Research Triangle growth |
| 8 | Massachusetts | 730K | Biotech, universities, finance, Boston-area property |
| 9 | Georgia | 690K | Atlanta corporate wealth, logistics, fintech, film |
| 10 | Virginia | 680K | Government contracting, tech, data centers, Northern Virginia |
California is not just first. It is first by an enormous margin. Its estimated 3.59 million millionaire households are almost double Florida’s count and more than the combined total of many regions of the country.
But Florida is the more interesting story. It is not just a retirement state anymore. Florida has become a financial migration machine. The combination of high-end real estate, no state income tax, private wealth relocation, hedge fund movement, and global capital has pushed it into the second position nationally.
Texas is also important, but in a different way. It has about as many millionaire households as New Jersey, yet its millionaire share is much lower because Texas has such a large total household base. Texas is a scale story. New Jersey is a density story.
The States With the Highest Share of Millionaire Households
Raw count tells us where the most millionaires live. Share tells us where wealth is most concentrated.
| Rank | State | Millionaire Share | Millionaire Households |
|---|---|---|---|
| 1 | Vermont | 35.7% | 100,000 |
| 2 | Hawaii | 35.4% | 170,000 |
| 3 | New Jersey | 29.6% | 960,000 |
| 4 | California | 28.9% | 3,590,000 |
| 5 | New Hampshire | 26.7% | 160,000 |
| 6 | Washington | 24.9% | 790,000 |
| 7 | Massachusetts | 24.5% | 730,000 |
| 8 | Utah | 23.2% | 260,000 |
| 9 | Rhode Island | 22.7% | 100,000 |
| 10 | Colorado | 22.3% | 540,000 |
This is where the story gets more interesting.
Vermont and Hawaii are not the largest millionaire markets, but they are the densest. In both states, more than one-third of covered households are estimated to have a net worth above $1 million.
That does not mean one-third of households are rich in the private-jet sense. It means home equity, retirement balances, land scarcity, second-home demand, and aging homeowner populations have pushed many households over the seven-figure line.
In Hawaii, the story is land scarcity and global demand. A normal home can make a household look rich on paper. In Vermont and New Hampshire, the story includes older homeowners, high property values, remote professionals, and inflows from Boston and New York.
New Jersey is the most underrated wealth state in America. It has almost a million millionaire households and one of the highest millionaire shares in the country. That is the effect of being positioned between New York City and Philadelphia, with dense suburban wealth, finance income, pharma wealth, and high home values.
Why California Still Dominates the Millionaire Map
California has three things most states cannot replicate.
First, it has massive public-company equity wealth. Apple, Nvidia, Alphabet, Meta, Netflix, Salesforce, and the broader venture ecosystem have created a long tail of employees, founders, early investors, and executives with seven-figure balance sheets.
Second, it has extremely valuable housing. Even households that would not feel wealthy in San Jose, San Mateo, Palo Alto, Los Angeles, or coastal Orange County can easily cross $1 million in net worth through home equity alone.
Third, it has one of the deepest private-company ecosystems in the world. Venture-backed equity does not always show up cleanly in public data, but it shapes the geography of wealth.
That is why California can simultaneously have a high millionaire share and intense affordability pressure. The same property and equity gains that created millions of paper millionaires also raised the cost of entry for everyone else.
Why Florida Has Become America’s Millionaire Migration State
Florida’s millionaire count tells one of the most important economic migration stories of the last decade.
The state has about 1.85 million millionaire households. That is not just because Florida has a large population. It is because Florida has become a destination for people who already have assets.
The drivers are clear:
- No state income tax
- High-end real estate in Miami, Palm Beach, Naples, Sarasota, and Tampa
- Retiree wealth moving from the Northeast and Midwest
- Finance and private equity migration into South Florida
- International wealth flowing into Miami real estate
- Business owners relocating after exits or liquidity events
Florida’s millionaire share, about 20.2%, is lower than California’s or New Jersey’s. But the absolute number is now huge, and it is still rising because the state attracts wealth from other states rather than relying only on local income creation.
The Texas Paradox: Many Millionaires, Lower Density
Texas has about 960,000 millionaire households, tied with New Jersey by count in this dataset. But Texas has a millionaire share of only about 9.5%.
That sounds counterintuitive until you look at the denominator. Texas has more than 10 million covered households in the dataset. It is a massive state with major wealth centers, but also a huge middle-income and lower-income population.
Texas wealth is concentrated around:
- Austin technology and startup equity
- Dallas private business ownership and finance
- Houston energy wealth
- Fort Worth family offices and old industrial capital
- High-growth suburbs with rising real estate values
The top 1% threshold in Texas is about $5.32 million, far below California, Florida, Washington, New York, and New Jersey. That suggests Texas has many affluent households, but the statewide threshold is moderated by its large and diverse population.
In plain English: Texas has a lot of millionaires, but it is not as universally wealthy as the raw count implies.
The Northeast Is Still the Densest Wealth Region
The Northeast remains the clearest region for millionaire density.
New Jersey, Massachusetts, New Hampshire, Vermont, Rhode Island, Connecticut, Maine, and Delaware all show high millionaire shares relative to their size.
The reasons are not mysterious:
- Older housing stock with large unrealized gains
- High education levels
- Proximity to finance, universities, healthcare, biotech, and government
- Older populations with accumulated retirement assets
- High property values
- Legacy family wealth
But the Northeast also shows a split. New Jersey and Massachusetts combine high median wealth with large millionaire populations. New York is more unequal. It has a huge millionaire count, but a relatively low median household net worth in this dataset. That reflects the gap between Manhattan, Westchester, Long Island, and wealthy suburbs on one side, and a much broader population with thinner balance sheets on the other.
The Mountain West Wealth Boom Is Real
Colorado, Utah, Idaho, Montana, Nevada, and Wyoming all show versions of the same story: migration plus scarcity plus asset appreciation.
Colorado has about 540,000 millionaire households and a top 1% threshold above $12.6 million. That is a major signal. The state is no longer just a lifestyle market. It is a serious wealth market, driven by Denver, Boulder, resort towns, energy fortunes, tech, and private business ownership.
Utah is even more surprising. Its median household net worth is estimated at about $601,000, tied with New Jersey in this dataset. That points to a mix of high savings, family formation, homeownership, business ownership, and tech wealth along the Salt Lake City to Provo corridor.
Idaho and Montana have smaller millionaire counts, but their data show how much migration and resort-market appreciation have changed the region. A decade ago, many people still thought of these states mainly through agriculture, timber, and tourism. Today, the wealth map includes remote tech workers, second-home buyers, business owners, and coastal migrants.
The States With the Fewest Millionaires
The states with the fewest millionaire households are generally smaller states or states with lower asset values.
| State | Millionaire Households | Millionaire Share |
|---|---|---|
| North Dakota | 20,000 | 7.7% |
| Alaska | 30,000 | 12.5% |
| Wyoming | 30,000 | 14.3% |
| Mississippi | 50,000 | 5.4% |
| New Mexico | 50,000 | 7.0% |
| South Dakota | 50,000 | 16.7% |
| Washington, D.C. | 50,000 | 13.2% |
| Montana | 60,000 | 14.6% |
| Kansas | 70,000 | 6.5% |
| West Virginia | 70,000 | 9.9% |
This list needs careful interpretation. Wyoming has only about 30,000 millionaire households, but its top 1% threshold is above $10 million. That tells us the state has a small population but a very high-end wealth pocket, especially around Jackson Hole.
South Dakota also has only about 50,000 millionaire households, but its millionaire share is much higher than Mississippi, Kansas, or Louisiana. South Dakota benefits from agriculture, finance, trust structures, and a small household base.
Mississippi has the lowest millionaire share in the dataset, about 5.4%. It also has the lowest top 1% threshold, about $2.94 million. That does not mean there is no wealth in Mississippi. It means that the statewide distribution is much lower than in high-property-value and high-equity states.
Net-Worth Millionaires vs Investable-Asset Millionaires
This is the section many articles skip, but it is essential.
A net-worth millionaire household can include home equity. An investable-asset millionaire usually means someone has at least $1 million in financial assets available to invest, often excluding a primary residence.
That is why the numbers differ so much.
Capgemini reported that the US reached about 8.7 million high-net-worth individuals in 2025, after adding 736,000 new millionaires during the year. But Capgemini’s HNWI definition is based on investable assets, not broad household net worth.
UBS, by contrast, places the US at nearly 40% of the world’s millionaires in its broader global wealth framework. That broader approach produces a higher millionaire count because it captures overall wealth, not just investable financial assets.
Here is the simple way to think about it:
| Definition | What It Measures | Why It Matters |
|---|---|---|
| Net-worth millionaire household | Household assets minus debts, often including home equity | Best for state wealth maps |
| Investable-asset millionaire | Individual with $1M+ in investable assets | Best for wealth management market sizing |
| Million-dollar earner | Tax filer with $1M+ annual income | Best for income and tax analysis |
| Ultra-high-net-worth individual | Often $30M+ in investable assets | Best for family office and private wealth analysis |
For this article, I use net-worth millionaire households as the headline number because the question is geographic: where do millionaire households live?
Why “Millionaire” Is Becoming Less Exclusive
The word millionaire still sounds elite, but the data show that it no longer means what it meant 30 years ago.
There are three reasons.
1. Home equity has inflated the millionaire count
In expensive housing markets, a household can become a millionaire without having much liquid wealth. A family that bought a modest Bay Area or coastal California home decades ago may now have a seven-figure net worth but still face high taxes, insurance, maintenance, and living costs.
This is why California, Hawaii, New Jersey, Massachusetts, and Washington score so high.
2. Stock ownership has become a bigger wealth engine
The Federal Reserve’s wealth data show how much household wealth is tied to financial assets and how concentrated those assets are at the top. When the stock market rises, millionaire counts rise. When the market falls, some households near the threshold fall back below it.
The AI equity boom has made this even more dramatic. Workers, founders, executives, and investors tied to technology stocks have benefited disproportionately from the latest wealth cycle.
3. Retirement accounts quietly create millionaires
Not every millionaire household looks rich. Many are older households with paid-off homes, retirement accounts, pensions, brokerage balances, and decades of compounding.
This helps explain why smaller states with older homeowners and strong property values can have surprisingly high millionaire shares.
What Most Millionaire-by-State Rankings Get Wrong
I see four recurring mistakes in this topic.
First, many rankings use old data and present it as current. Wealth shifted dramatically after 2020 because of home prices, stock prices, migration, and inflation.
Second, many articles do not distinguish between households and individuals. A married couple with $1.2 million in household net worth is not two millionaires in the same way two unrelated people with $1.2 million each are two millionaires.
Third, many rankings confuse income and wealth. A $1 million income year can come from a business sale, capital gain, bonus, or one-time transaction. It does not automatically mean the filer has a $1 million net worth after taxes and liabilities.
Fourth, most articles ignore cost of living. A $1.5 million net worth in Mississippi is not the same economic position as $1.5 million in Palo Alto, Honolulu, Boston, or Manhattan.
What the Millionaire Map Says About America in 2026
The state-by-state millionaire map reveals a country where wealth is being created through five engines.
The first engine is technology equity. California, Washington, Massachusetts, Utah, Colorado, North Carolina, and Texas all benefit from this.
The second engine is real estate scarcity. Hawaii, California, New Jersey, Massachusetts, Vermont, and Florida show this clearly.
The third engine is tax and lifestyle migration. Florida, Texas, Tennessee, Nevada, Idaho, Montana, and South Carolina have all benefited from wealth moving in.
The fourth engine is old-economy private business ownership. States like Arkansas, Iowa, Kansas, Kentucky, Wisconsin, Ohio, and Pennsylvania have fewer headlines but meaningful business and land-based fortunes.
The fifth engine is retirement and compounding. Many millionaire households are not flashy. They are older, asset-owning households that bought homes early, saved steadily, and benefited from decades of market returns.
My Bottom Line
The most honest answer to “how many millionaires by state” is this:
The US has roughly 21.8 million millionaire households in the 2026 covered state-level household dataset I analyzed, with the largest absolute numbers in California, Florida, New York, New Jersey, and Texas.
But the better insight is not just where millionaires are most numerous. It is where they are most concentrated.
By density, Vermont, Hawaii, New Jersey, California, New Hampshire, Washington, Massachusetts, Utah, Rhode Island, and Colorado stand out. These states show how property values, migration, age, retirement savings, and equity markets can push a large share of households above the $1 million mark.
Going forward, I am watching three things.
First, whether the AI-driven stock market continues to lift tech-heavy states faster than the rest of the country.
Second, whether housing affordability pressure slows the creation of new paper millionaires in expensive coastal markets.
Third, whether tax and lifestyle migration keep pushing millionaire households into Florida, Texas, Tennessee, Nevada, South Carolina, Idaho, and Montana.
The biggest uncertainty is that millionaire status is becoming less precise. A household can be wealthy on paper and cash-constrained in real life. A retiree can be a millionaire through home equity but still worry about insurance, healthcare, and property taxes. A founder can look rich in private equity before a liquidity event and then not be liquid at all.
That is why I would not treat the millionaire count as a simple measure of prosperity. I would treat it as a map of asset ownership. And in 2026, that map shows an America where wealth is broader than before, but still deeply concentrated by geography, age, housing, and access to equity.
Sources and Methodology
For this article, I define a millionaire household as a household with a net worth of at least $1 million. Net worth means total assets minus total liabilities. That includes home equity, retirement accounts, brokerage assets, business equity, cash, and other assets, minus debt.
There is no single official government database that directly reports “millionaire households by state.” Because of that, I treated the state-by-state millionaire counts as estimates, not official census figures. My baseline state-level estimate comes from Windfall’s 2026 wealth dataset, but I checked the broader methodology against the most authoritative public sources available.
The most important benchmark is the Federal Reserve’s Survey of Consumer Finances, which is the core U.S. household wealth survey and the best public source for understanding how American families hold assets, debt, home equity, retirement accounts, and financial wealth.
To understand how wealth is distributed across the country over time, I also used the Federal Reserve’s Distributional Financial Accounts, which tracks the level, composition, and share of U.S. household wealth held by different wealth-percentile groups.
For state-level income context, I used the IRS Statistics of Income program’s individual income tax state data. This is important because income and wealth are not the same thing. A household can report very high income in one tax year without having a $1 million net worth, and a retired homeowner can have a seven-figure net worth with modest annual income.
For household counts and state-level denominators, I used the Census Bureau’s American Community Survey 1-year data, which provides annual demographic and household estimates for all states and Washington, D.C.
Because home equity is one of the biggest drivers of millionaire status in expensive states, I also checked the housing side against the Federal Housing Finance Agency’s House Price Index, a repeat-sales index that tracks changes in single-family home values across the United States.
For broader state economic context, I used the Bureau of Economic Analysis regional economic accounts, which provide state GDP, state personal income, wages, compensation, and other regional economic measures.
Finally, I used the Congressional Budget Office’s report on trends in the distribution of family wealth to frame the long-term wealth inequality backdrop. The CBO data is useful because the millionaire map is not just a geography story. It is also a story about how asset ownership has become more concentrated over time.
My conclusion is that the state rankings should be read as rounded estimates of millionaire households, not exact official counts. The strongest interpretation is directional: California, Florida, New York, New Jersey, and Texas have the largest raw number of millionaire households, while Vermont, Hawaii, New Jersey, California, and New Hampshire have some of the highest millionaire-household density.
Independent Research Disclaimer
This article is independent research for informational purposes only. It is not financial, investment, tax, legal, or wealth-management advice. State-level millionaire household counts are rounded estimates based on third-party datasets and my own calculations from those datasets. Different definitions of “millionaire” can produce different results, especially when comparing household net worth, investable assets, and annual income.